Understanding Variation in Manufacturing
Updated: Dec 2, 2021
Variation is defined as “a change or slight difference in condition, amount, or level, typically within certain limits.” In this article we are concerned with variation within a manufacturing environment.
Every manufacturing process will have some level of variation. By this we mean that if we take measurements of an output of a process, we will observe that not all the measurements will be the same. The variation might be the length of a critical dimension, the resistivity of a material, or the force needed to fracture a material as a few examples.
If we take our output data from all the measurements, we could arrange them as a collection of values, distributed around a central (mean) value. From a statistical perspective, this is what we call spread or variability of the process. We can represent this variability using a numerical calculation, known as the variance.
If you have the measurement data for the full population (e.g. every part made) you can calculate the variance using the below formula:

This looks complicated at first, so let’s break it down. The calculation can be described as:
- Find the mean of the set of data.
- Subtract the mean from each number in the dataset.
- Square the result.
- Add the results together.
- Divide by the total number in the population
However, in reality, it is very rare that you would have every single data point. It is much more common that you would take a sample of data from a data set. For example, you may measure 100 random parts on a production line of thousands.
In this instance, the formula to measure the variance of a sample is:

Notice how the calculation is almost identical to the population variance, except we now divide by ‘n-1’, i.e. the sample size minus 1. It is not in the scope of this article to explain this slight difference, there are plenty of good online resources if you want to understand the underlying mathematics behind this. simply do an online search for Population vs Sample variance if you’re interested, but it is not too important for this article.
Standard Deviation
If this formula looks a little familiar to you, well done! The reason is because, if we take the square root of the variance you get the standard deviation. Standard variation is a very important measure throughout statistical process control.
As a reminder, the formula for standard deviation is:

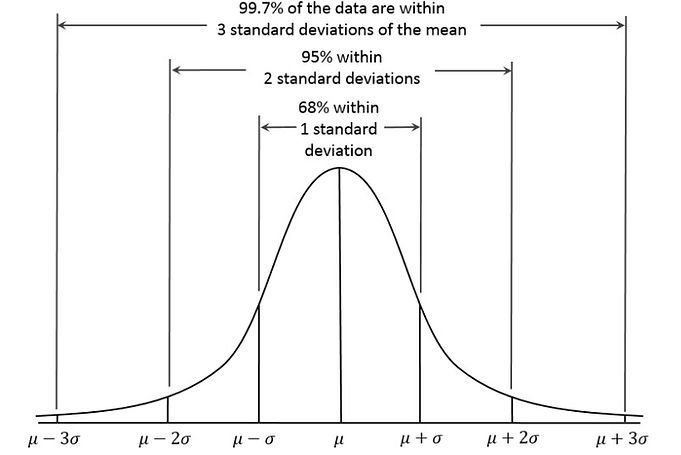
The standard deviation (square root of the variance) gives us information about the spread of the data, and therefore how good a manufacturing process is. This can be shown graphically through the Empirical Rule.
The empirical rule tells us that, for a process with a normal distribution:

This can be easily shown on the diagram below. The curve represents the deviation of the data set from the mean. The x-axis shows the number of standard deviations from the mean.
As you can see, roughly 68% of the data sits within +/- 1 deviation from the mean, 95% sits within 2 standard deviations and 99.7% sits within 3 standard deviations from the mean.

Controlled and Uncontrolled Variability
The reason for variability in a manufacturing process can come from many different sources (often referred to as a root-cause). One of the tasks of a Quality Engineer is to identify and quantify these different root-causes of variation, so that they can be eradicated.
These different sources of variation can be classified into two different groups, controlled variation, and uncontrolled variation. These are described more below.
Controlled Variation
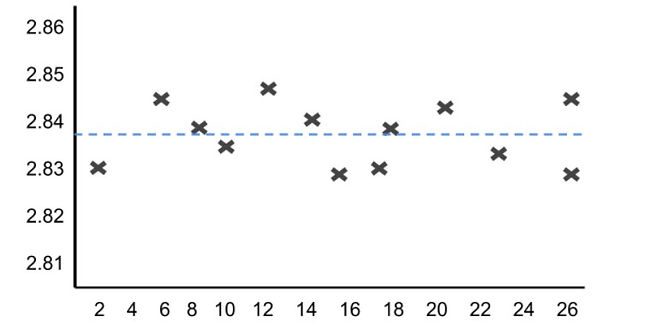
Controlled variation is characterised by a stable and consistent level of variation over time. This will be fluctuating about a constant mean and will be random in nature. A typical graph of controlled variation is shown below:

(Where the x-axis represents each item being measured, and the Y-axis measures the value being measured, e.g length of the part)
Uncontrolled Variation
Unlike controlled variation, if a pattern of variation changes over time the is therefore unpredictable, this is uncontrolled variation. Typically the mean of the data will seem to shift with time. A typical graph of uncontrolled variation is shown below:

In this plot the process is ‘out of control’, you can observe that the process is trending upwards after about observation 20.
For a manufacturing system, it is very important to know if a source of variation is controlled or not, as it determines if the process can be considered stable or not. A process is stable if it runs in a consistent and predictable manner. This means the mean is steady and variation is controlled (note, this does not necessarily mean that the process always manufactures good parts! But that it is consistent in what it does produce).
Controlled variation can be managed, and as a quality engineer you can either aim to reduce the magnitude of the variation (bring the parts closer to the mean) or increase your design specification to allow for this constant variation.
If the variation is uncontrolled, then the process mean will change over time, or the level of variation changes over time. This is not good news for a manufacturing system. There may be some external factor causing the variation, and it means the root-cause of the variation is likely changing over time making it more difficult to identify and control.
Conversely, uncontrolled cannot be managed effectively due to its changing nature. Nor can you change the design specification to allow for it, because you don’t know what the future ‘mean’ is likely to be.
One example of controlled variation might be the differences in the length of product due to changes in air temperature.
Typically, causes of controlled variation are known as common cause variation. This is because the cause is ‘common’ throughout the full manufacturing timescale.
One example of uncontrolled variation might be differences in a product strength due to a batch of faulty metal.
Typically, causes of uncontrolled variation are known as special cause variation. Special cause is a one-off or external influence on the manufacturing process.
Countering common cause variation
To counter common cause variation, you would use process monitoring, and a process change. Using our example above for air humidity. It would be sensible to keep a measure of the air humidity in the factory, and if this check finds the humidity is above a certain level then the operator would either need to change a parameter on the machine to compensate for it, or change the environmental conditions in the room to lower the humidity again.
Countering special cause variation
To counter special cause variation you need to put in emergency or external plans, these could be extra or replacement processes that we would only use if the special cause is present.
An example of an extra process would be to do a sample check of the material coming into the factory. If the material is found to be faulty, there may be an extra process to correct it (or reject it).
You should now have a good understanding on what variation is, how it affects a manufacturing process, and how to identify and deal with different types of variation.
Learn much more about manufacturing systems, and engineering quality within our Manufacturing Engineering courses, or view our full list of online engineering courses here.
Why not check out the online engineering short courses specifically in manufacturing engineering:
Recent Posts
Kirchhoff’s current and voltage laws
Kirchhoff’s current and voltage laws In our last article, we looked at the principles and operation of a d.c motor. In this article, we’re going to investigate Kirchoff’s current and voltage laws, as well as how to apply them to engineering problems. Kirchoff’s law of current Kirchoff’s law of current states that the algebraic sum […]
What are the principles of operation of a DC electric motor?
What are the principles of operation of a DC electric motor? In our last article, we looked at the electrical parameters in series and parallel electrical circuits. In this article, we’re going to dive into the principles of operation of a DC electric motor. The motor effect When a current-carrying conductor is placed on a […]
What are the electrical parameters in series and parallel electrical networks?
What are the electrical parameters in series and parallel electrical networks? In our last article, we looked at the principles of operation of electrical cells. In this article we’re going to move on to the electrical parameters in both series and parallel electrical networks. When we have circuits with more than one resistor, we need […]

